مقالات وأخبار عن إحصائية


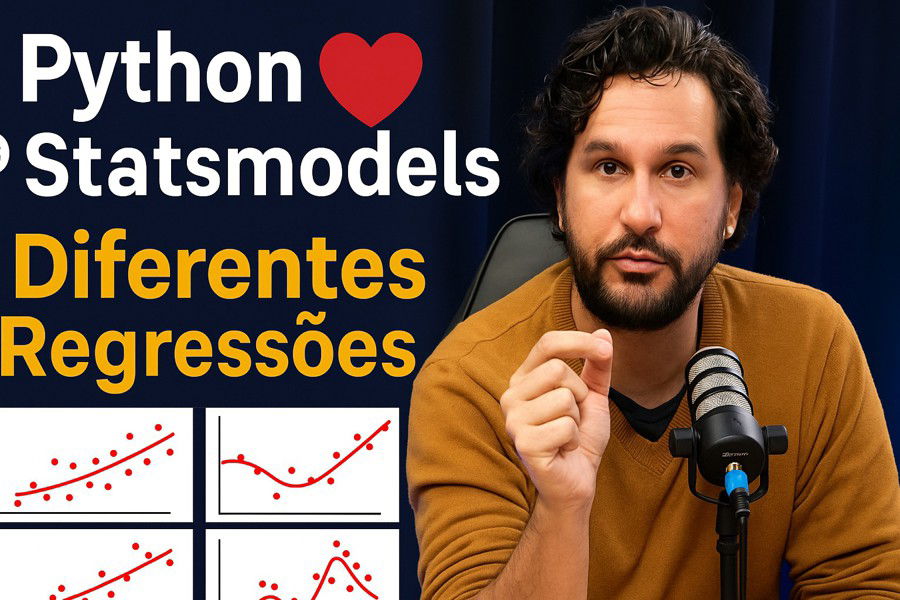
How to do Regression with Statsmodels in Python
Linear regression, ARIMA and multivariate regression with Statsmodels in Python, using real stock data: how to read the output and test the forecast.
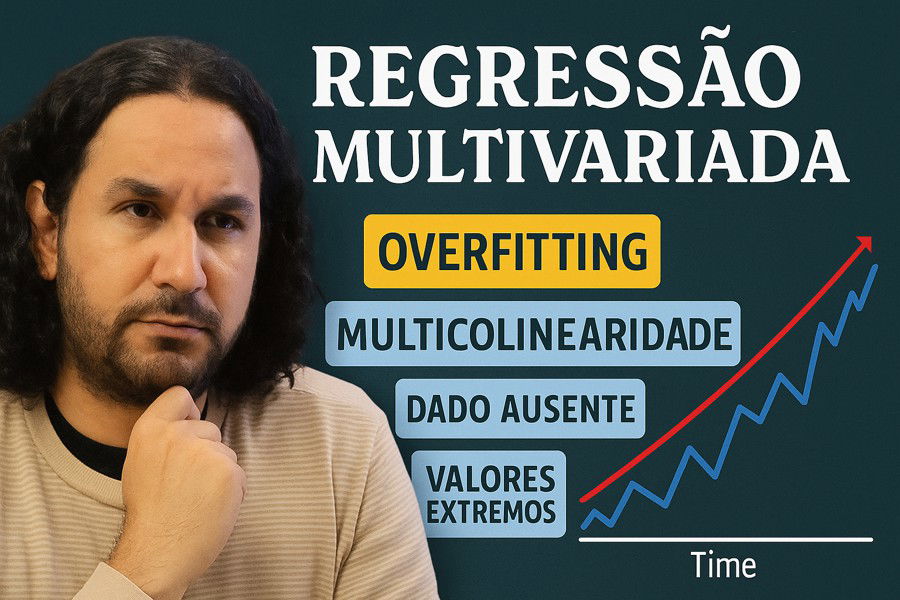
Multivariate Regression and its problems
Multiple linear regression: computing the coefficients with matrices and the problems of multicollinearity, overfitting, missing data and outliers.
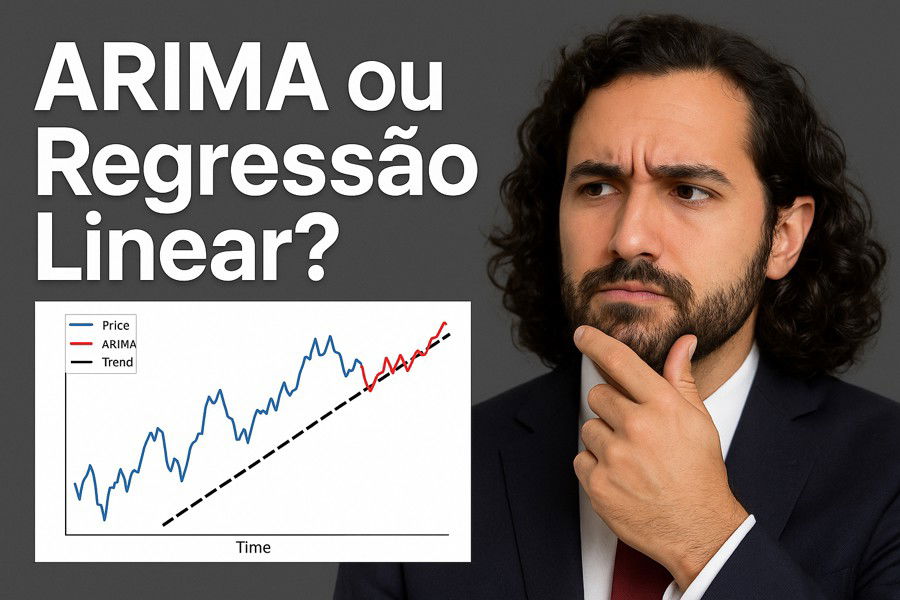
Regression Models over Time: ARIMA and Time Series
Understand the AR, I and MA components, ARIMA(p,d,q) notation, a step-by-step forecast, statsmodels code and exercises with an answer key.
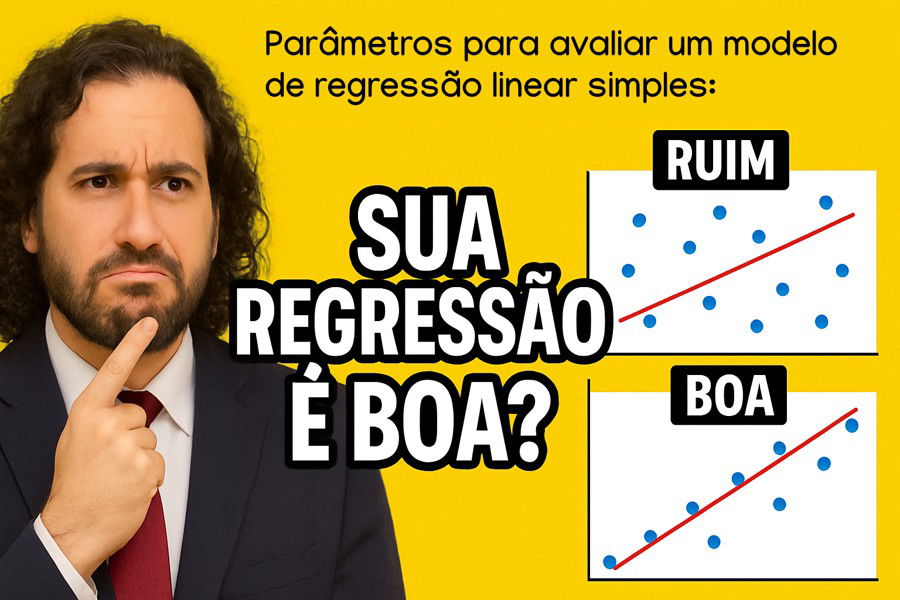
Parameters to evaluate a simple linear regression model: R² and SEE
How to evaluate a simple linear regression: residuals, SEE, t-test, confidence interval and R², with a step-by-step worked example and exercises.

Statistics in Python: Using Pandas to understand your distribution
Use pandas to compute mean, median, mode, standard deviation, CV, skewness and kurtosis, draw histograms and boxplots, and log-transform data.
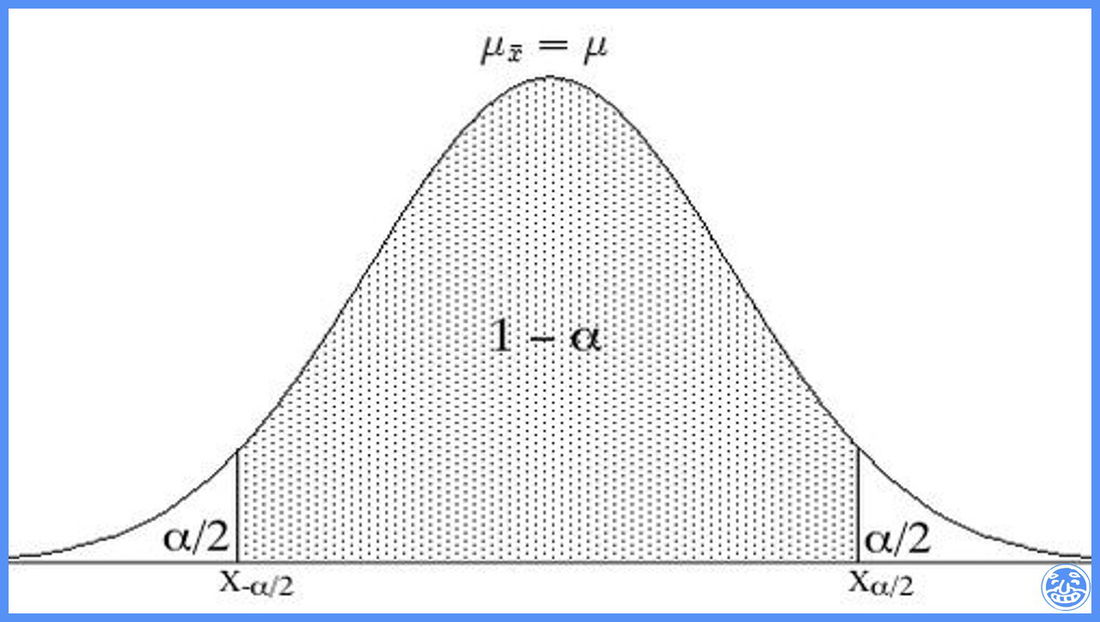
Statistical inference: confidence interval
Understand the confidence interval: sampling distribution of the mean, standard error, confidence level, how to calculate and interpret it, with exerc...

Data reduction: the different types of sampling
Population, sample and estimators: learn simple random, stratified and systematic sampling, with examples, exercises and answers.

Data reduction: identifying outliers
Found strange points in your data? Learn what outliers are, what to do with them and how to identify them with z-scores and box plots, with exercises.
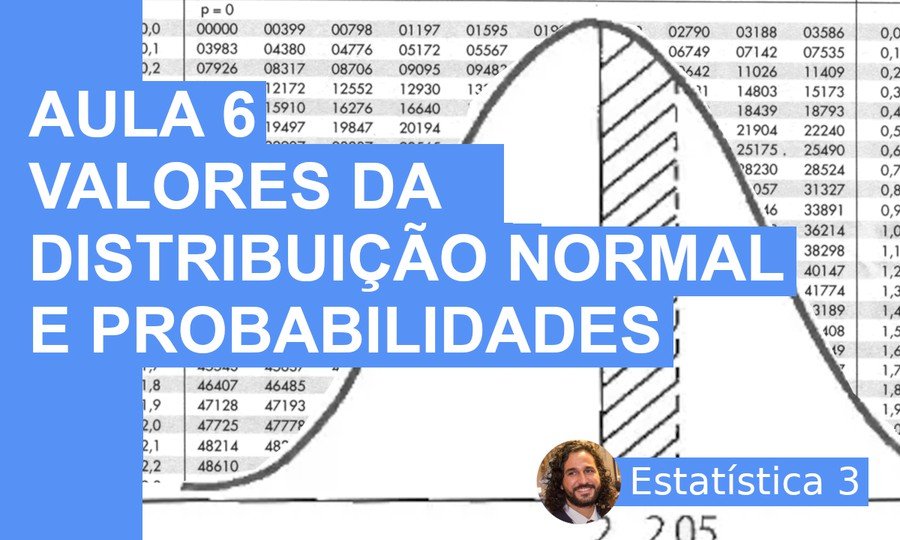
Normal distribution values from probabilities
How to find the value of a normal variable from a probability: reading the table backwards, x = μ + zσ and everyday business examples.
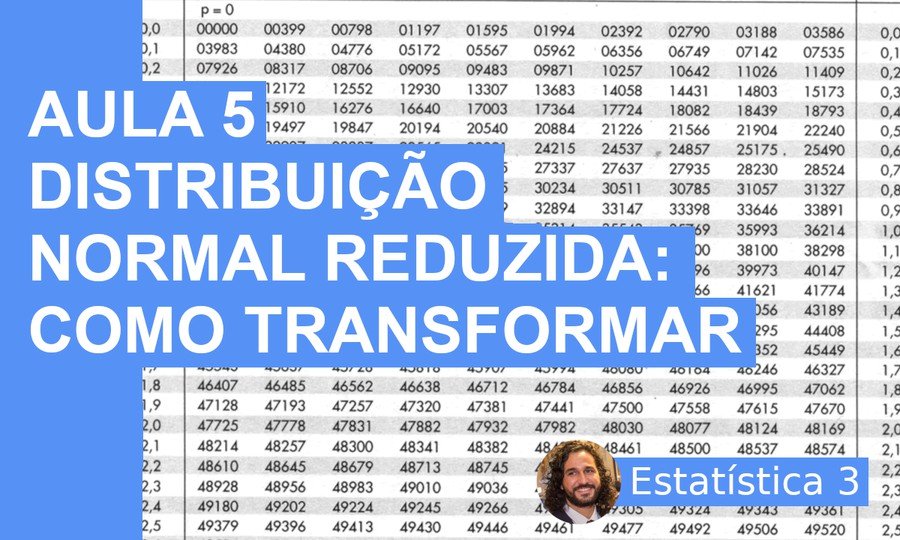
Standard normal distribution: how to transform
Learn to standardize a normal variable with z = (x − μ)/σ and use the standard normal table to calculate probabilities, with exercises.
Normal distribution and its history
From Bernoulli and the binomial to the central limit theorem: how the normal distribution arose, from de Moivre to Gauss, and where it shows up.

Exponential Distribution: Probability Density Functions
Exponential distribution: density, cumulative function, mean 1/λ, memorylessness and its link to the Poisson, with worked examples and exercises.
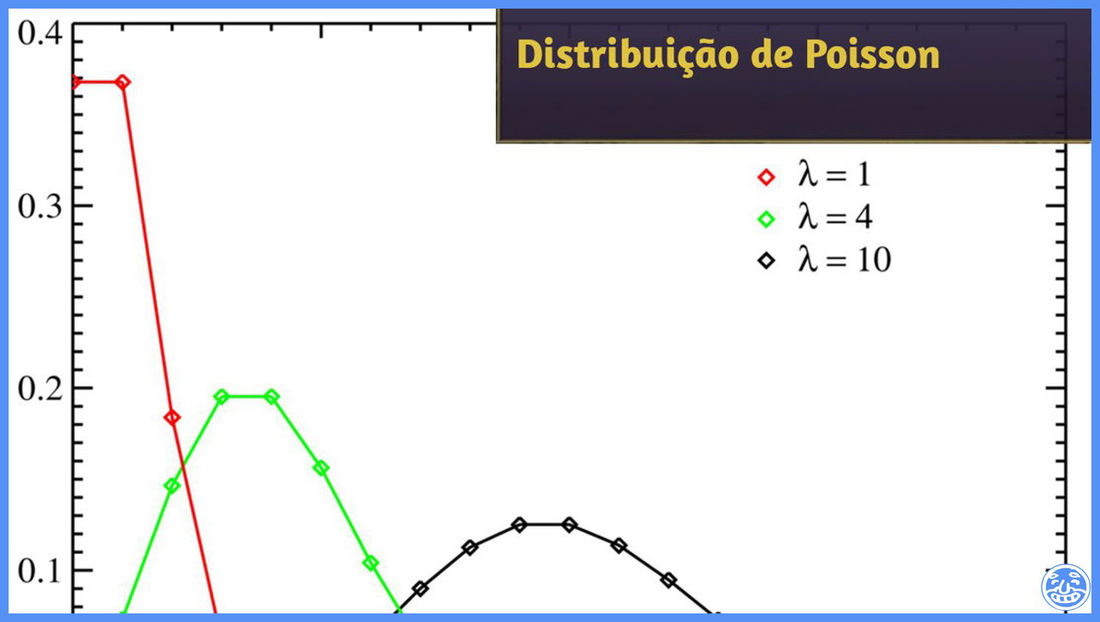
Applying the Poisson Distribution in real life
Learn to use the Poisson distribution in real situations: calls, accidents and defects, with worked examples, exercises and an answer key.

Bernoulli and Binomial Distribution: Real Life Applications
How the Bernoulli and binomial distributions model success or failure, with formulas, worked examples (coin, die, test) and exercises.

Multiplicative principle and simple combination
Fundamental counting principle, permutations with and without repetition, arrangements and combinations: when to use each, with examples and 28 exerci...

How to calculate probability: complementary events, independent events and more
Sample space, events, complementary events, addition and multiplication rules and independent events, with dice and coin examples and exercises.
Statistics and probability: their history and why are they so difficult?
Statistical models, the origins of probability, the heuristics that fool us and the Monty Hall problem: why our brain gets chance so wrong.

Measures of association or relationship: Linear Regression
How to describe the link between two variables with a straight line: slope, intercept, least squares and r², with solved exercises.

Measures of association or relationship: correlation
Scatter diagrams, linear correlation and Pearson's coefficient: how to calculate it, how to interpret it and its properties, with exercises.

Measures of association or relationship: covariance
The first measure of the relationship between two variables: what covariance is, two ways to calculate it, its properties and exercises with answers.